

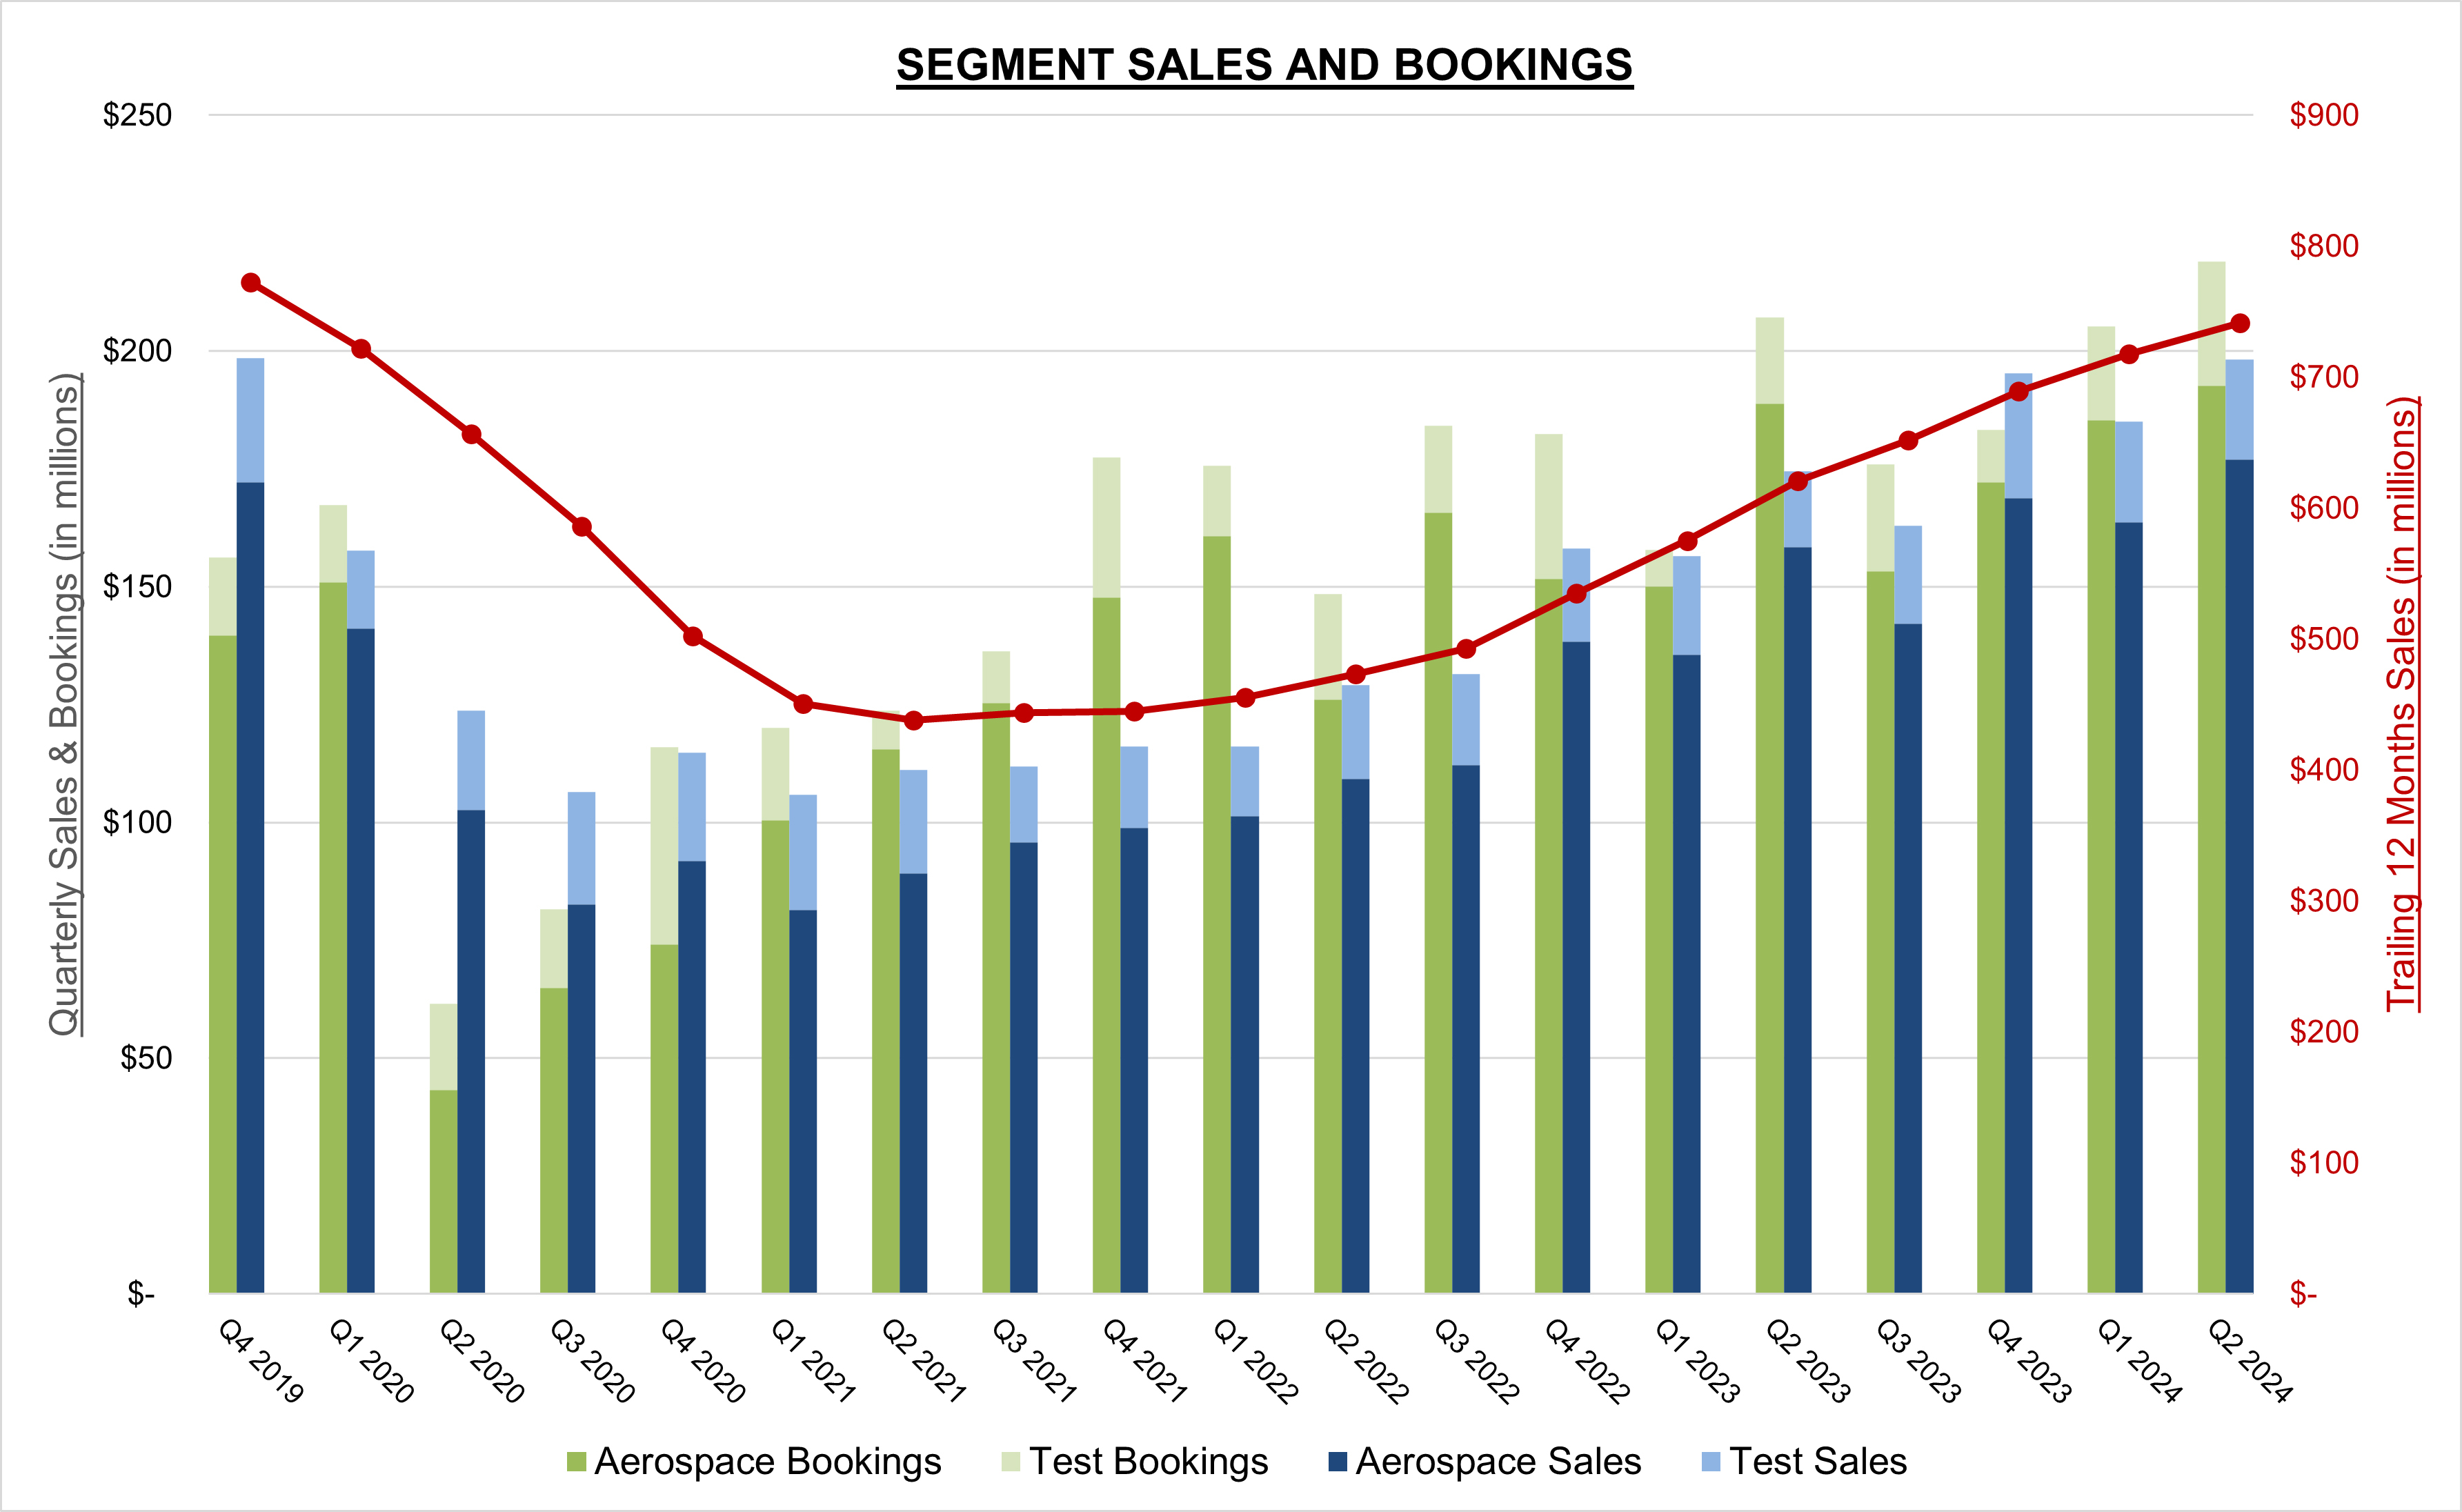
- Sales grew 14% to $198.1 million in the quarter
- Operating income increased to $7.6 million in the quarter, or 3.8% of sales
- Achieved net income for the quarter of $1.5 million, or $0.04 per diluted share
- Adjusted EBITDA1 grew 28% to $20.2 million, or 10.2% of sales, an increase of $4.4 million over the second quarter of the prior year
- Bookings in the quarter were $219.0 million, driving a record backlog of $633.4 million with book to bill ratio of 1.11x
- Aerospace achieved its tenth consecutive record backlog of $554.6 million
- Raising 2024 revenue guidance to $780 million to $800 million
EAST AURORA, N.Y.–(BUSINESS WIRE)–Astronics Corporation (Nasdaq: ATRO) (“Astronics” or the “Company”), a leading supplier of advanced technologies and products to the global aerospace, defense, and other mission-critical industries, today reported financial results for the three and six months ended June 29, 2024.
![]()
![]()
Peter J. Gundermann, Chairman, President and Chief Executive Officer, commented, “Our second quarter confirmed success with increased demand, new program wins, and our ability to deliver product to our customers more efficiently and predictably. We exceeded our guidance with 14% growth in sales and improved profitability. Bookings were at a post-pandemic high, resulting in yet another record backlog. Our strong performance supports raising our expectations for the year. Looking beyond 2024, our market leadership positions, the significant programs that we have won recently, and our high level of innovation point to a long runway for delivering value and improved earnings power.”
| ____________________________ |
|
1 Adjusted EBITDA is a Non-GAAP Performance Measure. Please see the attached table for a reconciliation of adjusted EBITDA to GAAP net income (loss). |
Second Quarter Results
|
|
Three Months Ended |
Six Months Ended |
||||||||||||||||||||
|
($ in thousands) |
June 29, 2024 |
July 1, 2023 |
% Change |
June 29, 2024 |
July 1, 2023 |
% Change |
||||||||||||||||
|
|
|
|
|
|
|
|
||||||||||||||||
|
Sales |
$ |
198,114 |
|
$ |
174,454 |
|
13.6 |
% |
$ |
383,188 |
|
$ |
330,992 |
|
15.8 |
% |
||||||
|
Income from Operations |
$ |
7,550 |
|
$ |
2,396 |
|
215.1 |
% |
$ |
9,216 |
|
$ |
26 |
|
35,346.2 |
% |
||||||
|
Operating Margin % |
|
3.8 |
% |
|
1.4 |
% |
|
|
2.4 |
% |
|
— |
% |
|
||||||||
|
Net Gain on Sale of Business |
$ |
— |
|
$ |
— |
|
|
$ |
— |
|
$ |
(3,427 |
) |
|
||||||||
|
Net Income (Loss) |
$ |
1,533 |
|
$ |
(11,999 |
) |
112.8 |
% |
$ |
(1,645 |
) |
$ |
(16,414 |
) |
90.0 |
% |
||||||
|
Net Income (Loss) % |
|
0.8 |
% |
|
(6.9 |
)% |
|
|
(0.4 |
)% |
|
(5.0 |
)% |
|
||||||||
|
|
|
|
|
|
|
|
||||||||||||||||
|
*Adjusted EBITDA |
$ |
20,243 |
|
$ |
15,844 |
|
27.8 |
% |
$ |
39,316 |
|
$ |
21,922 |
|
79.3 |
% |
||||||
|
*Adjusted EBITDA Margin % |
|
10.2 |
% |
|
9.1 |
% |
|
|
10.3 |
% |
|
6.6 |
% |
|
||||||||
|
*Adjusted EBITDA is a Non-GAAP Performance Measure. Please see the attached table for a reconciliation of adjusted EBITDA to GAAP net income (loss). |
||||||||||||||||||||||
Second Quarter 2024 Results (compared with the prior-year period, unless noted otherwise)
Consolidated sales were up $23.7 million, or 13.6%. Aerospace sales increased $18.6 million and Test Systems sales increased $5.1 million.
Consolidated operating income increased to $7.6 million, compared with operating income of $2.4 million in the prior-year period. Improved operating income reflects the operating leverage gained on higher sales volume, partially offset by $4.0 million in bonus expense as the Company’s incentive programs resumed in 2024.
Consolidated sales and operating profit were negatively impacted by $3.5 million due to a revision of estimated costs to complete certain long-term mass transit contracts in the Test Systems segment.
Consolidated net income was $1.5 million, or $0.04 per diluted share, measurably improved compared with the net loss of $12.0 million, or $0.37 per diluted share, in the prior year. Tax benefit in the quarter was $0.3 million, compared with tax expense of $8.1 million in the prior year.
Consolidated adjusted EBITDA increased to $20.2 million, or 10.2% of consolidated sales, compared with adjusted EBITDA of $15.8 million, or 9.1% of consolidated sales, in the prior-year period primarily as a result of higher sales.
Bookings were $219.0 million in the quarter resulting in a book-to-bill ratio of 1.11:1. For the trailing twelve months, bookings totaled $783.6 million and the book-to-bill ratio was 1.06:1.
Aerospace Segment Review (refer to sales by market and segment data in accompanying tables)
Aerospace Second Quarter 2024 Results (compared with the prior-year period, unless noted otherwise)
Aerospace segment sales increased $18.6 million, or 11.7%, to $176.9 million. The improvement was driven by a 14.6% increase, or $16.3 million, in Commercial Transport sales. Sales to this market were $128.4 million, or 64.8% of consolidated sales in the quarter, compared with $112.1 million, or 64.3% of consolidated sales in the second quarter of 2023. Higher airline spending drove increased demand.
Military Aircraft sales increased $11.2 million, or 82.4%, to $24.8 million, driven by progress on the FLRAA program as well as higher sales of lighting, safety and avionics products for military aircraft. General Aviation sales decreased $6.0 million, or 24.0%, to $19.0 million due to lower antenna and VVIP sales.
Aerospace segment operating profit of $19.3 million grew 41% compared with operating profit of $13.7 million in the same period last year. As a percent of sales, operating margin expanded to 10.9%, or 220 basis points over the prior-year period. Operating margin expansion reflects the leverage gained on higher volume and improving production efficiencies. Operating profit in the second quarter of 2024 was impacted by a $3.0 million increase in litigation-related legal expenses and reserve adjustments related to an ongoing patent dispute and $2.9 million related to the resumption of the Company’s incentive programs.
Aerospace bookings were $192.7 million for a book-to-bill ratio of 1.09:1. Backlog for the Aerospace segment was a record $554.6 million at quarter end.
Mr. Gundermann commented, “The strong demand for our Aerospace products and technologies continues to gain momentum as the aerospace industry recovers. Encouragingly, we are seeing strength across all of our Aerospace product lines. While our significant position in inflight entertainment and connectivity continues to grow, we are also seeing strong growth in our flight critical power and aircraft lighting thrusts. At the same time, we are continuing to become more efficient at delivering product reliably and predictably and the higher throughput is beginning to show the operating leverage that is inherent in our business.”
Test Systems Segment Review (refer to sales by market and segment data in accompanying tables)
Test Systems Second Quarter 2024 Results (compared with the prior-year period, unless noted otherwise)
Test Systems segment sales were $21.2 million, up $5.1 million. The improvement was driven by radio test sales following the award of the U.S. Army TS-4549/T contract, which contributed $7.2 million in sales during the quarter. However, segment sales were negatively impacted by $3.5 million due to a revision of estimated costs to complete certain long-term mass transit Test contracts. The revision resulted in reduced revenue recognized in the period due to lower estimates of the percentage of work completed on the programs.
Test Systems segment operating loss was $5.3 million, compared with operating loss of $6.1 million in the second quarter of 2023. The positive margin realized on the Army contract was offset by $3.5 million related to the revision of estimated costs noted above. Additionally, Test Systems continues to be negatively affected by mix and under absorption of fixed costs due to current volume.
In April 2024, the Test Systems segment implemented restructuring initiatives to align the workforce and management structure with near-term revenue expectations and operational needs resulting in $0.7 million in severance expense recognized during the second quarter. As part of the restructuring the Test business closed an operation in Kilgore, TX, simplifying its operations. We expect to realize annual savings of approximately $4 million from these activities, beginning in the third quarter.
Bookings for the Test Systems segment in the quarter were $26.4 million, including a $15.5 million initial booking for the U.S. Army TS-4549/T radio test set program. The book-to-bill ratio was 1.25:1 for the quarter. Backlog was $78.8 million at the end of the second quarter of 2024 compared with a backlog of $73.6 million at the end of the previous quarter.
Mr. Gundermann commented, “The second quarter was an important reset for our Test business. We finally were awarded the U.S. Army’s radio test program known as 4549/T, which we expect will bring revenue of $215 million or so over the next few years. We also completed a major restructuring of the business including the elimination of a peripheral manufacturing facility, our second of three such consolidations planned for the business. Finally, we performed our quarterly review of certain long-term mass transit contracts which resulted in an increase in the estimated costs to complete as the programs are not progressing as efficiently as expected. This was certainly a painful adjustment but, combined with the restructuring and the 4549/T award, we believe the business is set for a considerably brighter future.”
Liquidity and Financing
Capital expenditures in the quarter were $1.8 million and $3.4 million year-to-date. Net debt was $174.0 million, up from $161.2 million at December 31, 2023.
Cash used for operations in the second quarter of 2024 was primarily the result of a $16.7 million increase in accounts receivable which was related to increased sales and the timing of shipments.
On July 11, 2024, the Company announced it had amended and expanded its revolving line of credit and refinanced its term loan. The refinancing provides improved liquidity, lower cash costs, and greater financial flexibility for the Company. The refinancing is comprised of an expanded asset-based line of credit and a reduced, lower-cost term loan.
The revolving line of credit was expanded from $115 million to a $200 million maximum subject to the borrowing base, with an interest rate of SOFR plus 2.5% to 3.0% varying based on the Company’s consolidated leverage ratio. At closing, Astronics had $128 million drawn on the facility.
The new $55 million term loan has an interest rate of SOFR plus 5.5% to 6.75% varying based on the Company’s consolidated leverage ratio. Cash amortization of the new term loan will be approximately $550,000 annually, down from the previous rate of approximately $9.0 million.
The lower combined interest rate is expected to reduce interest expense by $2.0 million annually. The new debt structure afforded the Company approximately $50 million of available liquidity at closing, which was up from approximately $15 million prior.
Third quarter 2024 expenses will include refinancing-related fees, the call premium on the previous term loan and the write-off of deferred financing costs related to the previous financing. These expenses in total are estimated to be $7.5 million.
2024 Outlook
The Company is increasing its 2024 revenue guidance to $780 million to $800 million. The midpoint of this range would be a 15% increase over 2023 sales. Astronics considered the broad range of tailwinds affecting the business balanced against certain risks, including those associated with OEM production rates, in issuing its guidance.
The Company expects third quarter revenue to be in the range of $195 million to $205 million.
Backlog at the end of the second quarter was a record $633.4 million, of which approximately $402.3 million is expected to ship in 2024. Planned capital expenditures in 2024 are expected to be in the range of $17 million to $22 million.
Peter Gundermann commented, “We are making excellent progress as an organization, with first half 2024 sales up 15.8% and strong margin improvement. We believe the table is set for current trends to continue, and that 2024 will finish as a very strong year. Our innovative products are valued by our customers, we are executing on key wins after significant investments of time and money over the last few years, and we are regaining our operational stride which allows continued expansion of our margin profile and earnings.”
Second Quarter 2024 Webcast and Conference Call
The Company will host a teleconference today at 4:45 p.m. ET. During the teleconference, management will review the financial and operating results for the period and discuss Astronics’ corporate strategy and outlook. A question-and-answer session will follow.
The Astronics conference call can be accessed by calling (412) 317-0518. The listen-only audio webcast can be monitored at investors.astronics.com. To listen to the archived call, dial (412) 317-6671 and enter replay pin number 10189526. The telephonic replay will be available from 8:00 p.m. on the day of the call through Thursday, August 15, 2024. The webcast replay can be accessed via the investor relations section of the Company’s website where a transcript will also be posted once available.
About Astronics Corporation
Astronics Corporation (Nasdaq: ATRO) serves the world’s aerospace, defense, and other mission-critical industries with proven innovative technology solutions. Astronics works side-by-side with customers, integrating its array of power, connectivity, lighting, structures, interiors, and test technologies to solve complex challenges. For over 50 years, Astronics has delivered creative, customer-focused solutions with exceptional responsiveness. Today, global airframe manufacturers, airlines, military branches, completion centers, and Fortune 500 companies rely on the collaborative spirit and innovation of Astronics. The Company’s strategy is to increase its value by developing technologies and capabilities that provide innovative solutions to its targeted markets.
Safe Harbor Statement
This news release contains forward-looking statements as defined by the Securities Exchange Act of 1934. One can identify these forward-looking statements by the use of the words “expect,” “anticipate,” “plan,” “may,” “will,” “estimate,” “feeling” or other similar expressions and include all statements with regard to achieving any revenue or profitability expectations, aircraft production rates, the predictability of the supply chain and productivity of manufacturing personnel and efficiency of staff, the effectiveness on profitability of cost reduction efforts, the effect of pricing on margins, the execution of program wins, the benefit of market position, success with program awards and contributions of innovation, the length of the runway for improved earnings, the level of liquidity and its sufficiency to meet current needs, the rate of acceleration of the business, the level of cash generation, the level of demand by customers and markets. Because such statements apply to future events, they are subject to risks and uncertainties that could cause actual results to differ materially from those contemplated by the statements. Important factors that could cause actual results to differ materially from what may be stated here include the impact of global pandemics and related governmental and other actions taken in response, the trend in growth with passenger power and connectivity on airplanes, the state of the aerospace and defense industries, the market acceptance of newly developed products, internal production capabilities, the timing of orders received, the status of customer certification processes and delivery schedules, the demand for and market acceptance of new or existing aircraft which contain the Company’s products, the impact of regulatory activity and public scrutiny on production rates of a major U.S. aircraft manufacturer, the need for new and advanced test and simulation equipment, customer preferences and relationships, the effectiveness of the Company’s supply chain, and other factors which are described in filings by Astronics with the Securities and Exchange Commission. The Company assumes no obligation to update forward-looking information in this news release whether to reflect changed assumptions, the occurrence of unanticipated events or changes in future operating results, financial conditions or prospects, or otherwise.
FINANCIAL TABLES FOLLOW
|
ASTRONICS CORPORATION |
||||||||||||||||
|
CONSOLIDATED STATEMENT OF OPERATIONS DATA |
||||||||||||||||
|
(Unaudited, $ in thousands except per share data) |
||||||||||||||||
|
|
|
|
|
|||||||||||||
|
|
Three Months Ended |
|
Six Months Ended |
|||||||||||||
|
|
6/29/2024 |
|
7/1/2023 |
|
6/29/2024 |
|
7/1/2023 |
|||||||||
|
Sales1 |
$ |
198,114 |
|
|
$ |
174,454 |
|
|
$ |
383,188 |
|
|
$ |
330,992 |
|
|
|
Cost of products sold |
|
156,760 |
|
|
|
141,759 |
|
|
|
307,643 |
|
|
|
270,787 |
|
|
|
Gross profit |
|
41,354 |
|
|
|
32,695 |
|
|
|
75,545 |
|
|
|
60,205 |
|
|
|
Gross margin |
|
20.9 |
% |
|
|
18.7 |
% |
|
|
19.7 |
% |
|
|
18.2 |
% |
|
|
|
|
|
|
|
|
|
|
|||||||||
|
Selling, general and administrative |
|
33,804 |
|
|
|
30,299 |
|
|
|
66,329 |
|
|
|
60,179 |
|
|
|
SG&A % of sales |
|
17.1 |
% |
|
|
17.4 |
% |
|
|
17.3 |
% |
|
|
18.2 |
% |
|
|
Income from operations |
|
7,550 |
|
|
|
2,396 |
|
|
|
9,216 |
|
|
|
26 |
|
|
|
Operating margin |
|
3.8 |
% |
|
|
1.4 |
% |
|
|
2.4 |
% |
|
|
— |
% |
|
|
|
|
|
|
|
|
|
|
|||||||||
|
Net gain on sale of business2 |
|
— |
|
|
|
— |
|
|
|
— |
|
|
|
(3,427 |
) |
|
|
Other expense (income)3 |
|
435 |
|
|
|
378 |
|
|
|
871 |
|
|
|
(910 |
) |
|
|
Interest expense, net |
|
5,856 |
|
|
|
5,920 |
|
|
|
11,615 |
|
|
|
11,390 |
|
|
|
Income (loss) before tax |
|
1,259 |
|
|
|
(3,902 |
) |
|
|
(3,270 |
) |
|
|
(7,027 |
) |
|
|
Income tax (benefit) expense |
|
(274 |
) |
|
|
8,097 |
|
|
|
(1,625 |
) |
|
|
9,387 |
|
|
|
Net income (loss) |
$ |
1,533 |
|
|
$ |
(11,999 |
) |
|
$ |
(1,645 |
) |
|
$ |
(16,414 |
) |
|
|
Net income (loss) % of sales |
|
0.8 |
% |
|
|
(6.9 |
)% |
|
|
(0.4 |
)% |
|
|
(5.0 |
)% |
|
|
|
|
|
|
|
|
|
|
|||||||||
|
|
|
|
|
|
|
|
|
|||||||||
|
Basic earnings (loss) per share: |
$ |
0.04 |
|
|
$ |
(0.37 |
) |
|
$ |
(0.05 |
) |
|
$ |
(0.50 |
) |
|
|
Diluted earnings (loss) per share: |
$ |
0.04 |
|
|
$ |
(0.37 |
) |
|
$ |
(0.05 |
) |
|
$ |
(0.50 |
) |
|
|
|
|
|
|
|
|
|
|
|||||||||
|
Weighted average diluted shares outstanding (in thousands) |
|
35,547 |
|
|
|
32,614 |
|
|
|
34,936 |
|
|
|
32,560 |
|
|
|
|
|
|
|
|
|
|
|
|||||||||
|
Capital expenditures |
$ |
1,796 |
|
|
$ |
2,233 |
|
|
$ |
3,394 |
|
|
$ |
3,806 |
|
|
|
Depreciation and amortization |
$ |
6,203 |
|
|
$ |
6,711 |
|
|
$ |
12,531 |
|
|
$ |
13,373 |
|
|
| ____________________________ |
|
1 In the six months ended July 1, 2023, $5.8 million was recognized in sales related to the reversal of a deferred revenue liability recorded with a previous acquisition within our Test Systems Segment. |
|
2 Net gain on sale of business for the six months ended July 1, 2023 is comprised of the additional gain on the sale of the Company’s former semiconductor test business resulting from the contingent earnout for the 2022 calendar year. |
|
3 Other expense (income) for the six months ended July 1, 2023 includes income of $1.8 million associated with the reversal of a liability related to an equity investment, as we will no longer be required to make the associated payment. |
Reconciliation to Non-GAAP Performance Measures
In addition to reporting net income, a U.S. generally accepted accounting principle (“GAAP”) measure, we present Adjusted EBITDA (earnings before interest, income taxes, depreciation and amortization, non-cash equity-based compensation expense, goodwill, intangible and long-lived asset impairment charges, equity investment income or loss, legal reserves, settlements and recoveries, restructuring charges, gains or losses associated with the sale of businesses and grant benefits recorded related to the AMJP program), which is a non-GAAP measure. The Company’s management believes Adjusted EBITDA is an important measure of operating performance because it allows management, investors and others to evaluate and compare the performance of its core operations from period to period by removing the impact of the capital structure (interest), tangible and intangible asset base (depreciation and amortization), taxes, equity-based compensation expense, goodwill, intangible and long-lived asset impairment charges, equity investment income or loss, non-cash reserves related to customer bankruptcy filings, legal reserves, settlements and recoveries, litigation-related expenses, restructuring charges, gains or losses associated with the sale of businesses and grant benefits recorded related to the AMJP program, which is not commensurate with the core activities of the reporting period in which it is included. As such, the Company uses Adjusted EBITDA as a measure of performance when evaluating its business and as a basis for planning and forecasting. Adjusted EBITDA is not a measure of financial performance under GAAP and is not calculated through the application of GAAP. As such, it should not be considered as a substitute for the GAAP measure of net income and, therefore, should not be used in isolation of, but in conjunction with, the GAAP measure. Adjusted EBITDA, as presented, may produce results that vary from the GAAP measure and may not be comparable to a similarly defined non-GAAP measure used by other companies.
|
ASTRONICS CORPORATION |
||||||||||||||||
|
RECONCILIATION OF NET INCOME (LOSS) TO ADJUSTED EBITDA |
||||||||||||||||
|
(Unaudited, $ in thousands) |
||||||||||||||||
|
|
|
|
|
|
|
|
|
|||||||||
|
|
Consolidated |
|||||||||||||||
|
|
Three Months Ended |
|
Six Months Ended |
|||||||||||||
|
|
6/29/2024 |
|
7/1/2023 |
|
6/29/2024 |
|
7/1/2023 |
|||||||||
|
Net income (loss) |
$ |
1,533 |
|
|
$ |
(11,999 |
) |
|
$ |
(1,645 |
) |
|
$ |
(16,414 |
) |
|
|
Add back (deduct): |
|
|
|
|
|
|
|
|||||||||
|
Interest expense |
|
5,856 |
|
|
|
5,920 |
|
|
|
11,615 |
|
|
|
11,390 |
|
|
|
Income tax (benefit) expense |
|
(274 |
) |
|
|
8,097 |
|
|
|
(1,625 |
) |
|
|
9,387 |
|
|
|
Depreciation and amortization expense |
|
6,203 |
|
|
|
6,711 |
|
|
|
12,531 |
|
|
|
13,373 |
|
|
|
Equity-based compensation expense |
|
1,840 |
|
|
|
1,593 |
|
|
|
4,642 |
|
|
|
3,992 |
|
|
|
Non-cash annual stock bonus accrual |
|
— |
|
|
|
— |
|
|
|
1,448 |
|
|
|
— |
|
|
|
Non-cash 401K contribution and quarterly bonus accrual |
|
— |
|
|
|
1,328 |
|
|
|
3,454 |
|
|
|
2,536 |
|
|
|
Restructuring-related charges including severance |
|
657 |
|
|
|
564 |
|
|
|
774 |
|
|
|
564 |
|
|
|
Legal reserve, settlements and recoveries |
|
— |
|
|
|
(1,305 |
) |
|
|
— |
|
|
|
(1,305 |
) |
|
|
Litigation-related legal expenses |
|
4,428 |
|
|
|
4,935 |
|
|
|
8,122 |
|
|
|
9,450 |
|
|
|
Equity investment accrued payable write-off |
|
— |
|
|
|
— |
|
|
|
— |
|
|
|
(1,800 |
) |
|
|
Net gain on sale of business |
|
— |
|
|
|
— |
|
|
|
— |
|
|
|
(3,427 |
) |
|
|
Deferred liability recovery |
|
— |
|
|
|
— |
|
|
|
— |
|
|
|
(5,824 |
) |
|
|
Adjusted EBITDA |
$ |
20,243 |
|
|
$ |
15,844 |
|
|
$ |
39,316 |
|
|
$ |
21,922 |
|
|
|
|
|
|
|
|
|
|
|
|||||||||
|
Sales |
$ |
198,114 |
|
|
$ |
174,454 |
|
|
$ |
383,188 |
|
|
$ |
330,992 |
|
|
|
Adjusted EBITDA margin on sales |
10.2 |
% |
9.1 |
% |
10.3 |
% |
6.6 |
% |
||||||||
|
ASTRONICS CORPORATION |
||||||
|
CONSOLIDATED BALANCE SHEET DATA |
||||||
|
($ in thousands) |
||||||
|
|
(unaudited) |
|
|
|||
|
|
6/29/2024 |
|
12/31/2023 |
|||
|
ASSETS |
|
|
|
|||
|
Cash and cash equivalents |
$ |
2,857 |
|
$ |
4,756 |
|
|
Restricted cash |
|
1,535 |
|
|
6,557 |
|
|
Accounts receivable and uncompleted contracts |
|
186,295 |
|
|
172,108 |
|
|
Inventories |
|
200,679 |
|
|
191,801 |
|
|
Other current assets |
|
21,039 |
|
|
14,560 |
|
|
Property, plant and equipment, net |
|
82,511 |
|
|
85,436 |
|
|
Other long-term assets |
|
32,957 |
|
|
34,944 |
|
|
Intangible assets, net |
|
58,843 |
|
|
65,420 |
|
|
Goodwill |
|
58,143 |
|
|
58,210 |
|
|
Total assets |
$ |
644,859 |
|
$ |
633,792 |
|
|
|
|
|
|
|||
|
LIABILITIES AND SHAREHOLDERS’ EQUITY |
|
|
|
|||
|
Current maturities of long-term debt |
$ |
1,300 |
|
$ |
8,996 |
|
|
Accounts payable and accrued expenses |
|
122,207 |
|
|
112,309 |
|
|
Customer advances and deferred revenue |
|
17,635 |
|
|
22,029 |
|
|
Long-term debt |
|
172,635 |
|
|
159,237 |
|
|
Other liabilities |
|
73,202 |
|
|
81,703 |
|
|
Shareholders’ equity |
|
257,880 |
|
|
249,518 |
|
|
Total liabilities and shareholders’ equity |
$ |
644,859 |
|
$ |
633,792 |
|
|
ASTRONICS CORPORATION |
||||||||
|
CONSOLIDATED CASH FLOWS DATA |
||||||||
|
|
|
|
|
|||||
|
|
Six Months Ended |
|||||||
|
(Unaudited, $ in thousands) |
6/29/2024 |
|
7/1/2023 |
|||||
|
Cash flows from operating activities: |
|
|
|
|||||
|
Net loss |
$ |
(1,645 |
) |
|
$ |
(16,414 |
) |
|
|
Adjustments to reconcile net loss to cash from operating activities: |
|
|
|
|||||
|
Non-cash items: |
|
|
|
|||||
|
Depreciation and amortization |
|
12,531 |
|
|
|
13,373 |
|
|
|
Amortization of deferred financing fees |
|
1,695 |
|
|
|
1,363 |
|
|
|
Provisions for non-cash losses on inventory and receivables |
|
2,415 |
|
|
|
1,705 |
|
|
|
Equity-based compensation expense |
|
4,642 |
|
|
|
3,992 |
|
|
|
Net gain on sale of business |
|
— |
|
|
|
(3,427 |
) |
|
|
Operating lease non-cash expense |
|
2,562 |
|
|
|
2,563 |
|
|
|
Non-cash 401K contribution and quarterly bonus accrual |
|
3,454 |
|
|
|
2,536 |
|
|
|
Non-cash annual stock bonus accrual |
|
1,448 |
|
|
|
— |
|
|
|
Non-cash deferred liability reversal |
|
— |
|
|
|
(5,824 |
) |
|
|
Other |
|
1,827 |
|
|
|
(1,275 |
) |
|
|
Cash flows from changes in operating assets and liabilities: |
|
|
|
|||||
|
Accounts receivable |
|
(15,281 |
) |
|
|
(22,619 |
) |
|
|
Inventories |
|
(11,398 |
) |
|
|
(22,638 |
) |
|
|
Accounts payable |
|
(4,661 |
) |
|
|
14,081 |
|
|
|
Accrued expenses |
|
9,255 |
|
|
|
5,611 |
|
|
|
Income taxes |
|
(4,487 |
) |
|
|
7,422 |
|
|
|
Operating lease liabilities |
|
(2,447 |
) |
|
|
(2,674 |
) |
|
|
Customer advance payments and deferred revenue |
|
(4,280 |
) |
|
|
959 |
|
|
|
Supplemental retirement plan liabilities |
|
(209 |
) |
|
|
(206 |
) |
|
|
Other assets and liabilities |
|
356 |
|
|
|
321 |
|
|
|
Net cash used by operating activities |
|
(4,223 |
) |
|
|
(21,151 |
) |
|
|
Cash flows from investing activities: |
|
|
|
|||||
|
Proceeds on sale of business and assets |
|
— |
|
|
|
3,427 |
|
|
|
Capital expenditures |
|
(3,394 |
) |
|
|
(3,806 |
) |
|
|
Net cash used by investing activities |
|
(3,394 |
) |
|
|
(379 |
) |
|
|
Cash flows from financing activities: |
|
|
|
|||||
|
Proceeds from long-term debt |
|
15,392 |
|
|
|
131,732 |
|
|
|
Principal payments on long-term debt |
|
(9,498 |
) |
|
|
(112,774 |
) |
|
|
Stock award and employee stock purchase plan activity |
|
(3,172 |
) |
|
|
(601 |
) |
|
|
Financing-related costs |
|
(1,837 |
) |
|
|
(6,388 |
) |
|
|
Finance lease principal payments |
|
(70 |
) |
|
|
(24 |
) |
|
|
Other |
|
(10 |
) |
|
|
— |
|
|
|
Net cash provided by financing activities |
|
805 |
|
|
|
11,945 |
|
|
|
Effect of exchange rates on cash |
|
(109 |
) |
|
|
101 |
|
|
|
Decrease in cash and cash equivalents and restricted cash |
|
(6,921 |
) |
|
|
(9,484 |
) |
|
|
Cash and cash equivalents and restricted cash at beginning of period |
|
11,313 |
|
|
|
13,778 |
|
|
|
Cash and cash equivalents and restricted cash at end of period |
$ |
4,392 |
|
|
$ |
4,294 |
|
|
Contacts
Company:
David C. Burney, Chief Financial Officer
(716) 805-1599, ext. 159
david.burney@astronics.com
Investor Relations:
Deborah K. Pawlowski, Kei Advisors LLC
(716) 843-3908
dpawlowski@keiadvisors.com